

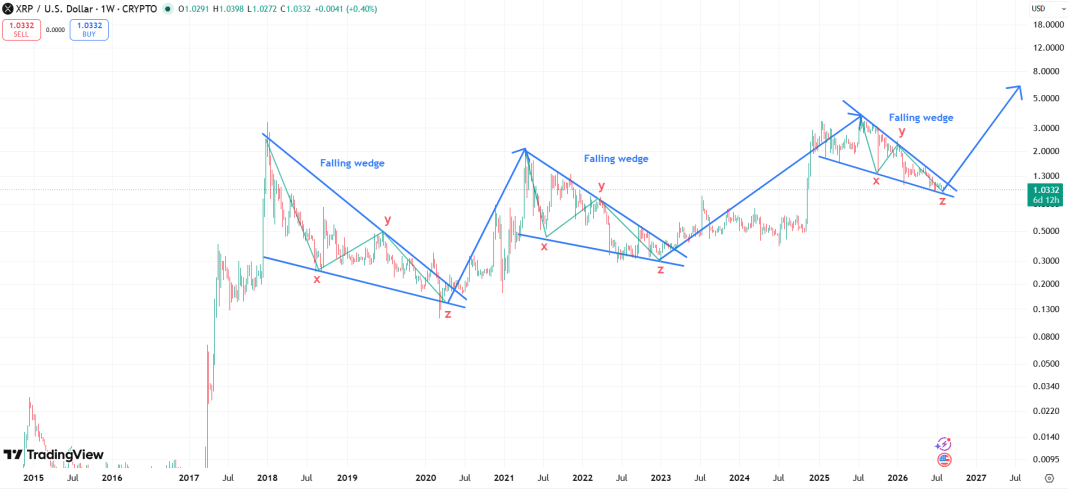
$XRP is currently trading within a falling wedge that has appeared only twice in its history, with each previous occurrence leading to a subsequent price surge.
This comes as the asset continues to face downward pressure alongside the rest of the crypto market. This year, $XRP has collapsed 43.8%, currently trading for $1.03, as bears look to breach below the psychological $1 mark.
Since October 2025, when this downtrend began, $XRP has recorded only two monthly gains, each just above 2%. Within this period, $XRP has witnessed eight monthly losing candlesticks.
However, the falling wedge structure suggests that the downtrend may now be close to an end, and $XRP could secure a bullish recovery if it follows its historical pattern.
$XRP Historical Price Action Within the Falling Wedge
For context, the first falling wedge started playing out when $XRP dropped from the $3.31 peak in January 2018. From here, $XRP witnessed a steep decline, losing most of the earlier gains and dumping below the $1 mark.
Within the falling wedge, the price action resolved into an xyz corrective wave before a breakout ensued. Specifically, the x Wave involved the price crash from $3.31 in January 2018 to a low of $0.2451 by August 2018, retesting the lower trendline of the wedge.
After this, Wave y brought a relief bounce to $0.50 by June 2019, but this high aligned with the resistance at the upper trendline of the wedge, leading to another pullback. This pullback pushed $XRP to the $0.11 low by March 2020, again aligning with the support at the lower trendline and culminating in the final z Wave.
$XRP Falling Wedge
Following this xyz structure, $XRP broke above the upper trendline of the wedge and eventually soared to a high of $1.96 in April 2021. However, the asset could not exceed the $3.31 peak due to increased selling pressure from the SEC vs. Ripple case, which began in December 2020.
Notably, from the $1.96 high in 2021, $XRP collapsed and entered another falling wedge structure. After finishing the xyz corrective wave at $0.33 by January 2023, $XRP broke above the wedge and eventually claimed the $3.66 all-time high in July 2025.
$XRP Slips Into the Third Wedge
The drop from $3.66 has now resulted in the third bullish wedge, as $XRP continues to suffer steep declines in the ongoing market-wide downtrend.
So far, $XRP has only completed Waves x and y of the corrective structure, with the current pullback attempting to finalize the pattern. Notably, Wave x involved $XRP’s decline from $3.66 to $1.37 in October 2025. Meanwhile, Wave y triggered a recovery from $1.37 to $2.41 by January 2026.
Now, Wave z has led to a corrective phase from the $2.41 high to the current price of $1.03. However, data shows $XRP may still record steeper declines, possibly dropping toward the $0.80 to $0.90 range before Wave z officially ends.
Once this happens, the ensuing rebound push could take $XRP above the upper trendline of the wedge, leading to a breakout. This would mark the end of the downtrend, with $XRP possibly soaring to a new all-time high once market momentum returns.
However, it is important to note that, while a recovery to new highs is feasible, the timeline remains uncertain. For instance, after the breakout above the second wedge, $XRP took over two years to reach a new all-time high.