


Solana price fell about 5% from its July 27 high near $77 to $73 on July 28 as a break below short-term support triggered long liquidations.
Solana price drops back toward $73
According to data from crypto.news, Solana ($SOL) price traded near $73.20 at the time of writing after falling from an intraday high around $77 during the previous session. The move represented a decline of about 5% from peak to trough.
The pullback followed $SOL’s latest rejection from the upper half of a descending channel visible on the 4-hour chart. Buyers pushed the token toward $77 on July 27 but failed to challenge the channel’s upper boundary or the wider $78 resistance area.
Selling accelerated after $SOL lost the $75 level, which had supported several earlier intraday rebounds. The token subsequently fell toward $73 before entering a narrow consolidation range.
The daily chart showed $SOL trading below the Murrey Math major support-and-resistance pivot at $75. Its July 28 candle recorded a low of $72.86, although buyers prevented a sustained fall below $73.
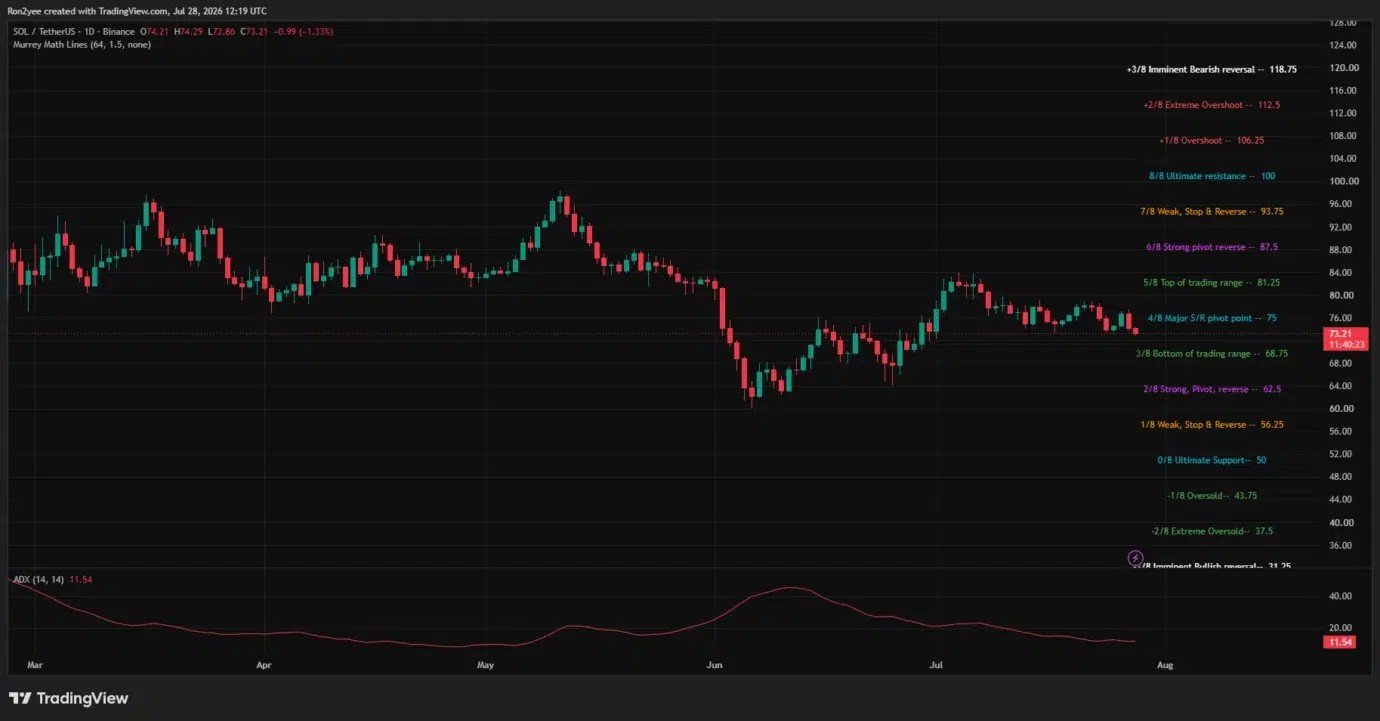
Solana price daily chart — July 28 | Source: crypto.news
$SOL’s decline also came as capital showed a preference for Ethereum. $ETH recently reclaimed $1,900, while $SOL remained trapped below its July resistance range.
Crypto trader Daan Crypto Trades noted that the pair was beginning to lose its horizontal support area.
“[Solana] needs to break this local consolidation before we can start looking at the range high again.”
Daan added that Ethereum’s recent strength against Bitcoin had left Solana behind, making the $ETH ecosystem more attractive while $SOL remained weak.
Long liquidations accelerated the sell-off
The three-day CoinGlass liquidation heatmap shows that Solana’s slide cut through several leveraged trading zones between $75 and $73.
$SOL first dropped sharply below $75 before falling through another band of liquidity around $73. The move likely forced leveraged long traders to close their positions, adding market sell orders to an already weak spot market.
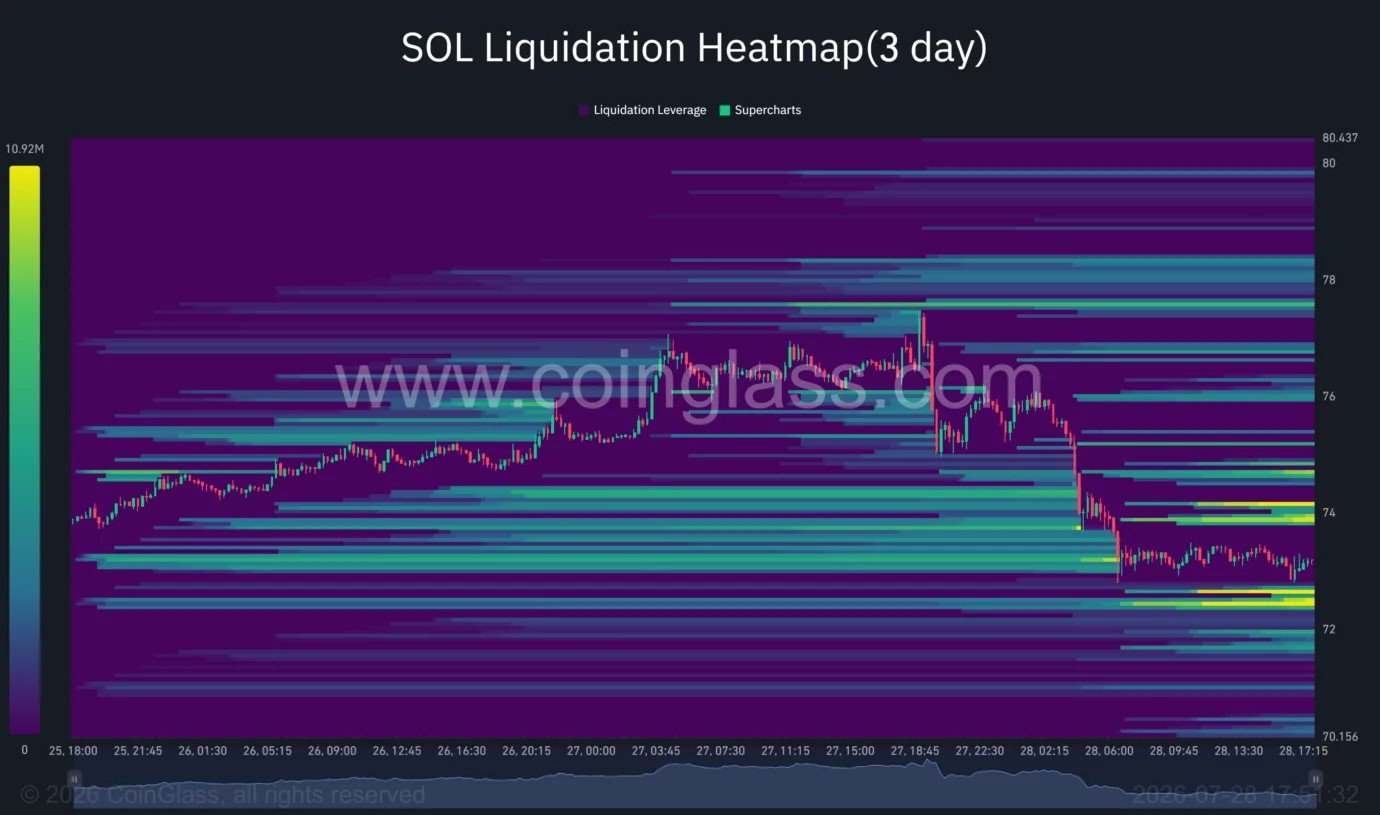
Solana liquidation heatmap | Source: CoinGlass
The heatmap shows that the largest nearby concentrations now sit on both sides of the current price. A bright liquidity band has formed around $72.40–$72.70, while additional clusters are visible near $73.80–$74.20.
This positioning could keep short-term price action unstable. A move below $73 may attract $SOL toward the lower liquidity pool, while an initial rebound could target the accumulated positions around $74.
Further liquidation interest is visible near $75 and $76.50. Those levels could act as upside targets if buyers regain control, but they may also become resistance because traders caught in the decline could use a recovery to exit positions.
The liquidation data support the view that derivatives positioning magnified the decline. However, the charts alone do not establish that institutional sell blocks caused the move.
$SOL indicators point to weak momentum
Solana remains inside a descending parallel channel that has guided its 4-hour price action since the early-July peak above $83. The channel has produced a sequence of lower highs, including rejections near $79 and $77.

Solana price is trading within a descending parallel channel pattern on the 4-hour chart — July 28 | Source: crypto.news
$SOL is now approaching the channel’s lower half. The lower boundary sits close to $70, making that level the next broader technical support if $73 fails.
The 4-hour relative strength index has fallen to 35.57, below its signal average of 47.33. The reading shows that sellers control short-term momentum, although $SOL has not yet entered the conventional oversold zone below 30.
Aroon readings also favor the downside, with the stronger line at 78.57% compared with 57.14% for the opposing measure. The indicator reflects the recency of price highs and lows rather than the size of a move, but its current configuration is consistent with $SOL’s recent lower low.
On the daily chart, the average directional index stands at only 11.54. An ADX reading below 20 normally indicates a weak trend, suggesting $SOL is still consolidating rather than entering a confirmed directional breakdown.
That weak reading leaves room for false moves around support. $SOL could briefly sweep liquidity below $73 before recovering, particularly if selling pressure in the derivatives market eases.
Solana price levels to watch next
The first level buyers need to recover is $74. A move above that area would allow $SOL to challenge the $75 pivot, which has changed from support into near-term resistance.
A daily close above $75 would weaken the immediate bearish case. Bulls would then need to clear $77–$78 and break above the descending channel to reopen a path toward the July high around $83.
Failure to reclaim $75 would leave $SOL exposed to another test of the $72.50 liquidation cluster. Below that area, the channel boundary near $70 becomes the next likely target.
The daily Murrey Math chart places the bottom of the broader trading range at $68.75. That level may provide stronger support if a breakdown below $70 develops. A deeper correction could then extend toward the $62.50 pivot, although the current low ADX reading does not yet confirm such a move.
Fed decision adds risk for US traders
US investors are also awaiting the Federal Reserve’s next policy decision. Interest-rate expectations, movements in the dollar and Treasury yields can affect demand for high-risk assets such as $SOL.
Treasury yields eased on July 28, while oil prices also fell as markets responded to renewed hopes for diplomacy in the Middle East. Brent traded below $87 and US crude near $81, reversing part of the inflation-driven pressure seen earlier in the week. The pullback reportedly followed a pause in attacks and renewed hopes for a US-Iran agreement.
That means $SOL’s latest decline appears more closely linked to its technical breakdown and leveraged positioning than to a fresh rise in oil or Treasury yields. The Fed decision could still determine whether US liquidity conditions help $SOL recover $75 or push it toward lower support.